Printer Friendly
PL/R and PostGIS
In this tutorial we will explore using PostGIS and PL/R together. Some examples we will quickly run thru.
- Median Function in conjunction with PostGIS
- Voronoi Diagrams
If you missed part one of our series and are not familiar with R or PL/R, please read
http://www.bostongis.com/PrinterFriendly.aspx?content_name=postgis_tut01
Getting started with PostGIS and
http://www.bostongis.com/PrinterFriendly.aspx?content_name=postgresql_plr_tut01
PLR Part 1: Up and Running with PL/R (PLR) in PostgreSQL: An almost Idiot's Guide
Next create a new PostgreSQL database using the template_postgis
database as template and load in the PLR support functions as described
in the above article. For this particular exercise, we will assume the
database is called testplrpostgis.
Loading Some Test GIS Data
We will be working with census data from MassGIS. Click the
following "Download This Layer" - census2000blockgroups_poly.exe,
from this link
http://www.mass.gov/mgis/cen2000_blockgroups.htm
Get the Massachusetts Town Polygon geometries from this link
http://www.mass.gov/mgis/townssurvey.htm Townsurvey points - ESRI Shapefiles
Get the Massachusetts Census Blocks from this link
http://www.mass.gov/mgis/cen2000_blocks.htm
Get Massachusetts Schools Layer from here
http://www.mass.gov/mgis/schools.htm
Extract the files into a folder (running the exe,right-click
extract, and for Linux/Unix/MacOS just extracting with unzip or stuffit
or some other similar package)
Now load the shape files into your test database using shp2pgsql by
doing the following at your OS commandline. Note for non-windows users
or if you installed PostgreSQL in a non-standard directory - change the
path to yours - default being "C:\Program Files\PostgreSQL\8.2\bin\".
Also replace items in italics with those that match your environment.
"C:\Program Files\PostgreSQL\8.2\bin\shp2pgsql" -s 26986 C:\Data\massgis\census2000blockgroups_poly cens2000bgpoly > cens2000bgpoly.sql


"C:\Program Files\PostgreSQL\8.2\bin\psql" -h localhost -U postgres -d testplrpostgis -f cens2000bgpoly.sql


"C:\Program Files\PostgreSQL\8.2\bin\psql" -h localhost -U postgres -d testplrpostgis -c "CREATE INDEX idx_cens2000bgpoly_the_geom ON cens2000bgpoly USING GIST(the_geom)"


"C:\Program Files\PostgreSQL\8.2\bin\shp2pgsql" -s 26986 C:\Data\massgis\TOWNSSURVEY_POLY towns > towns.sql


"C:\Program Files\PostgreSQL\8.2\bin\psql" -h localhost -U postgres -d testplrpostgis -f towns.sql


"C:\Program Files\PostgreSQL\8.2\bin\psql" -h localhost -U postgres -d testplrpostgis -c "CREATE INDEX idx_towns_the_geom ON towns USING GIST(the_geom)"


"C:\Program Files\PostgreSQL\8.2\bin\psql" -h localhost -U postgres -d testplrpostgis -c "CREATE INDEX idx_towns_town ON towns USING btree(town)"


"C:\Program Files\PostgreSQL\8.2\bin\shp2pgsql" -s 26986 C:\Data\massgis\SCHOOLS_PT schools > schools.sql


"C:\Program Files\PostgreSQL\8.2\bin\psql" -h localhost -U postgres -d testplrpostgis -f schools.sql


"C:\Program Files\PostgreSQL\8.2\bin\psql" -h localhost -U postgres -d testplrpostgis -c "CREATE INDEX idx_schools_the_geom ON towns USING GIST(the_geom)"


"C:\Program Files\PostgreSQL\8.2\bin\shp2pgsql" -s 26986 C:\Data\massgis\census2000blocks_poly cens2000blocks > cens2000blocks.sql


"C:\Program Files\PostgreSQL\8.2\bin\psql" -h localhost -U postgres -d testplrpostgis -f cens2000blocks.sql


"C:\Program Files\PostgreSQL\8.2\bin\psql" -h localhost -U postgres -d testplrpostgis -c "CREATE INDEX idx_cens2000blocks_the_geom ON cens2000blocks USING GIST(the_geom)"


"C:\Program Files\PostgreSQL\8.2\bin\psql" -h localhost -U postgres -d testplrpostgis -c "vacuum analyze"
Using Median function in conjunction with POSTGIS constructs
In this example - we will find out the median population of a town
census blockgroup, total population of all block groups within the
town, and average population of a town census blockgroup, and count of
block groups for each town
that is within each towns boundary for all Massachusetts towns. Note: we have to do a geomunion here because the towns layer has multiple records per town.
Unioning will consolidate so we have a single multipolygon for each town.
The below example assumes you installed the PL/R aggregate median function as described in part one of this tutorial.
SELECT t.town, count(bg.gid) as total_bg, avg(bg.total_pop) as avg_bg_pop,
median(bg.total_pop) as median_pop, sum(bg.total_pop) as totalpop
FROM cens2000bgpoly bg,
(SELECT towns.town, geomunion(the_geom) as the_geom
     FROM towns GROUP BY towns.town) t
WHERE bg.the_geom && t.the_geom AND within(bg.the_geom, t.the_geom)
GROUP BY t.town
ORDER BY t.town
The above took about 37859ms ms on my windows 2003 server and 71922
ms on my Windows XP pc, but leaving out the median call did not speed it
up much so bottleneck is in the geometry joining part.
If the subquery was a commonly used construct, then we would materialize it as a table and index it appropriately.
CREATE TABLE townsingle AS
SELECT MAX(gid) as gid, towns.town, geomunion(the_geom) as the_geom
     FROM towns GROUP BY towns.town;

CREATE INDEX idx_townsingle_the_geom ON townsingle USING GIST(the_geom);
CREATE UNIQUE INDEX idx_townsingle_gid ON townsingle USING btree(gid);
CREATE UNIQUE INDEX idx_townsingle_town ON townsingle USING btree(town);
Installing R Packages
Before we continue, we need to expand our R environment by installing deldir package which contains voronoi functionality. In order to do so,
please follow these steps.
We will be using the deldir package - I listed some other packages here because they looked interesting, but we won't have time to
explore those in too much detail in this exercise
- Open up your RGUI console
- At the console prompt type the following
chooseCRANmirror()
This command should pop open a dialog requesting you to pick a mirror. Pick one closest to you and click OK.
- At the console prompt type
utils:::menuInstallPkgs()
This command should pop open a dialog listing all the packages available in your selected CRAN mirror.
If the above doesn't work try
available.packages()
to get a command line listing of packages available at your chosen CRAN mirror.
- Hold the control-key down and select the packages listed above and then click ok
For a list of what other packages are available and what they do check out http://cran.us.r-project.org/src/contrib/PACKAGES.html
Alternatively for example if you did available.packages(), you can install the packages individually by doing for example< br/>
install.packages('deldir')
where in this case deldir is the name of the package we wish to install.
Exploring Help in R
R offers some neat features as far as help goes that you can access
straight from the R GUI console. Below are some useful commands to find
out more about a package or drill in at examples.
- List functions and summary about a package - help(package=<package name>) Example:
help(package=deldir)
- Search all help text for a particular phrase - help.search('<phrase>') Example:
help.search('median')
- See list of demos available in all installed packages - Example:
demo(package = .packages(all.available = TRUE))
- Load a library and then run a demo in that library
library(packagename)
demo(<demo name>) -
Example: libary(gstat)
demo(block)
Delaunay Triangulation and Dirichlet Package
In this example we will use a voronoi PL/R implementation provided by Mike Leahy in the PostGIS users newsgroup - http://postgis.refractions.net/pipermail/postgis-users/2007-June/016102.html
The function and voronoi type code is repeated below: Run the below in PgAdmin or psql. Note for Windows users - if you are copying this - make sure to paste in Notepad and save the file and then open in PgAdmin or psql. This will strip the carriage returns and just leave line breaks. R parser chokes on carriage returns.
--This function uses the deldir library in R to generate voronoi polygons for an input set of points in a PostGIS table.

--Requirements:
--  R-2.5.0 with deldir-0.0-5 installed
--  PostgreSQL-8.2.x with PostGIS-1.x and PL/R-8.2.0.4 installed

--Usage: select * from voronoi('table','point-column','id-column');

--Where:
--  'table' is the table or query containing the points to be used for generating the voronoi polygons,
--  'point-column' is a single 'POINT' PostGIS geometry type (each point must be unique)
--  'id-column' is a unique identifying integer for each of the originating points (e.g., 'gid')

--Output: returns a recordset of the custom type 'voronoi', which contains the id of the
--  originating point, and a polygon geometry

create type voronoi as (id integer, polygon geometry);
create or replace function voronoi(text,text,text) returns setof voronoi as '
    library(deldir)

    # select the point x/y coordinates into a data frame...
    points <- pg.spi.exec(sprintf("select x(%2$s) as x, y(%2$s) as y from %1$s;",arg1,arg2))

    # calculate an approprate buffer distance (~10%):
    buffer = ((abs(max(points$x)-min(points$x))+abs(max(points$y)-min(points$y)))/2)*(0.10)

    # get EWKB for the overall buffer of the convex hull for all points:
    buffer <- pg.spi.exec(sprintf("select buffer(convexhull(geomunion(%2$s)),%3$.6f) as ewkb from %1$s;",arg1,arg2,buffer))

    # the following use of deldir uses high precision and digits to prevent slivers between the output polygons, and uses
    # a relatively large bounding box with four dummy points included to ensure that points in the peripheral areas of the
    # dataset are appropriately enveloped by their corresponding polygons:
    voro = deldir(points$x, points$y, digits=22, frac=0.00000000000000000000000001,list(ndx=2,ndy=2), rw=c(min(points$x)-abs(min(points$x)-max(points$x)), max(points$x)+abs(min(points$x)-max(points$x)), min(points$y)-abs(min(points$y)-max(points$y)), max(points$y)+abs(min(points$y)-max(points$y))))
    tiles = tile.list(voro)
    poly = array()
    id = array()
    p = 1
    for (i in 1:length(tiles)) {
        tile = tiles[[i]]

        curpoly = "POLYGON(("

        for (j in 1:length(tile$x)) {
             curpoly = sprintf("%s %.6f %.6f,",curpoly,tile$x[[j]],tile$y[[j]])
        }
        curpoly = sprintf("%s %.6f %.6f))",curpoly,tile$x[[1]],tile$y[[1]])

        # this bit will find the original point that corresponds to the current polygon, along with its id and the SRID used for the
        # point geometry (presumably this is the same for all points)...this will also filter out the extra polygons created for the
        # four dummy points, as they will not return a result from this query:
        ipoint <- pg.spi.exec(sprintf("select %3$s as id, intersection(''SRID=''||srid(%2$s)||'';%4$s'',''%5$s'') as polygon from %1$s where intersects(%2$s,''SRID=''||srid(%2$s)||'';%4$s'');",arg1,arg2,arg3,curpoly,buffer$ewkb[1]))
        if (length(ipoint) > 0)
        {
            poly[[p]] <- ipoint$polygon[1]
            id[[p]] <- ipoint$id[1]
            p = (p + 1)
        }
    }
    return(data.frame(id,poly))
' language 'plr';
After you have installed the above Voronoi function. Test it out with the following code
CREATE TABLE schools_voroni(gid int);

SELECT AddGeometryColumn('', 'schools_voroni', 'the_geom', 26986, 'POLYGON',2);

INSERT INTO schools_voroni(gid, the_geom)
    SELECT v.id, v.polygon
        FROM voronoi('(SELECT gid, the_geom
        FROM schools
            WHERE town = ''BOSTON'' AND grades LIKE ''%3%'' AND type = ''PUB'') as bs', 'bs.the_geom', 'bs.gid') As v

ALTER TABLE schools_voroni
  ADD CONSTRAINT pk_schools_voroni PRIMARY KEY(gid);
Below is a map of the public elementary schools in Boston overlayed on the Voronoi Polygons of those schools
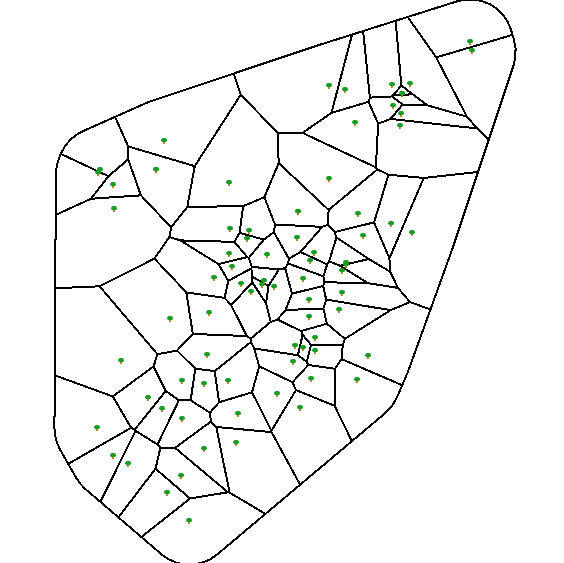
At this moment, some people may be thinking - Nice polygons, but what is this supposed to tell me about Boston public elementary schools?
Well the short simplistic answer is that the Voronoi polygon of a school tells you theoretically what area a school serves, all else being equal. To find out more about this interesting topic, checkout Voronoi links and tidbits.
For example we assume people prefer to send their kids to schools near them.
With this information and using census blocks, we can theoretically figure out which areas are underserved based on population of elementary school kids
in that voroni polygon area, relative to the number of schools serving that area. So a query something like
(NOTE I had only population not elementary school population so this is theoretically flawed already.)
 CREATE TABLE vorhighdens As
SELECT v.thegid, sum(pop_2000)/v.schcount As vpop, v.the_geom
FROM (SELECT MAX(gid) as thegid, COUNT(gid) As schcount, the_geom, area(the_geom) as the_area
FROM schools_voroni
GROUP BY the_geom, area(the_geom)) As v
    INNER JOIN cens2000blocks cb ON v.the_geom && cb.the_geom AND Within(cb.the_geom, v.the_geom)
GROUP BY v.the_geom, v.schcount, v.thegid
ORDER BY vpop DESC LIMIT 5
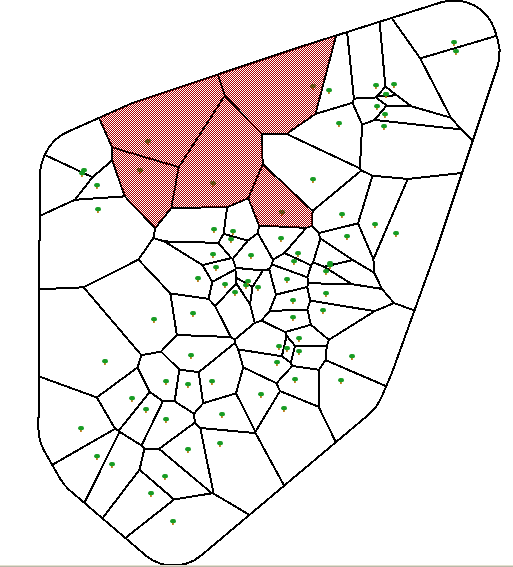
The darkened areas are where based on my simple model, more elementary schools need to be built. Please NOTE this model
is gravely flawed for many reasons
- I have not taken into consideration the size of each school (assumed all are the same size)
- My model is using overall population which in certain areas - like where I live - very few kids live here since its filled with yuppie executives, DINKS, and retired wealthy folk so the population here is probably very skewed.
- I assumed census blocks fit nicely in a voronoi zone which may or may not be true. In theory this is probably not too bad of an assumption
- I assumed all elementary schools are created equal. For example some schools have special needs programs that others do not.
Hopefully there is enough
here to demonstrate how a real model would work.
Post Comments About PLR Part 2: PL/R and PostGIS